workshop
Workshop materials, responses, and final products for DATA 100 at W&M (Spring 2020).
Project 2: Investigating Land Use and Land Cover - Mongolia
Part 1: Histograms with Density Plots and Linear Models
This part of the project involved taking land use and land cover variables and using them to make predictions of population values. (This was done using land use and land cover variables from 2015 and population values from 2019 due to the fact that the 2015 population values would not download. However, the population does not seem to be growing drastically in any direction.) First, for reference, these are histograms of the population and density of Khovsgol.
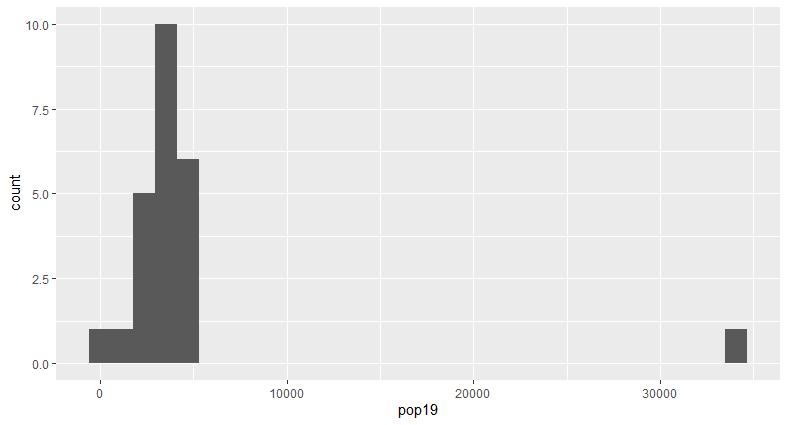 This shows that the majority of ADM subdivisions within Khovsgol have a population below 10,000, and only one ADM subdivision is over that, with a population of > 30,000.
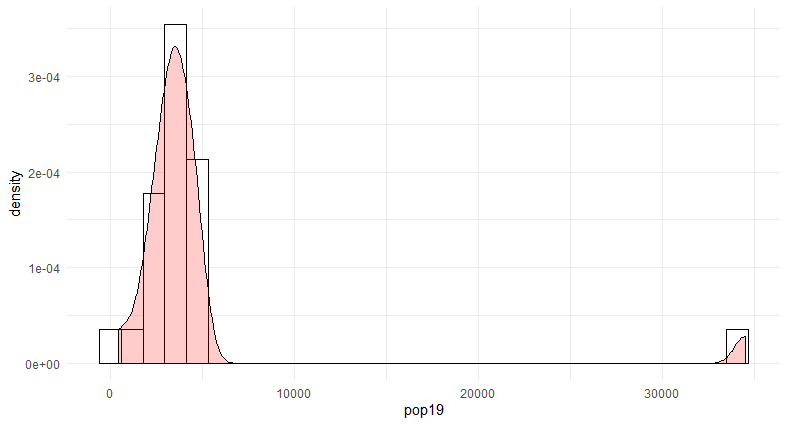 This plot maps the population with the corresponding population density values, which are very low.
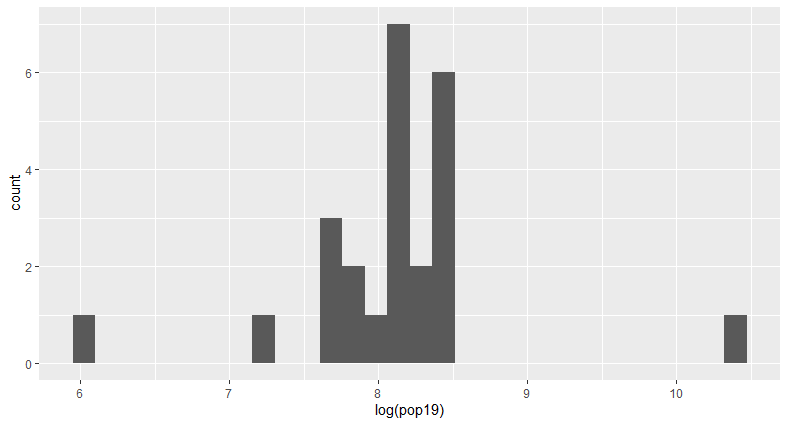 This plot shows the logarithm of the population, which shows a more even distribution of the population through Khovsgol.
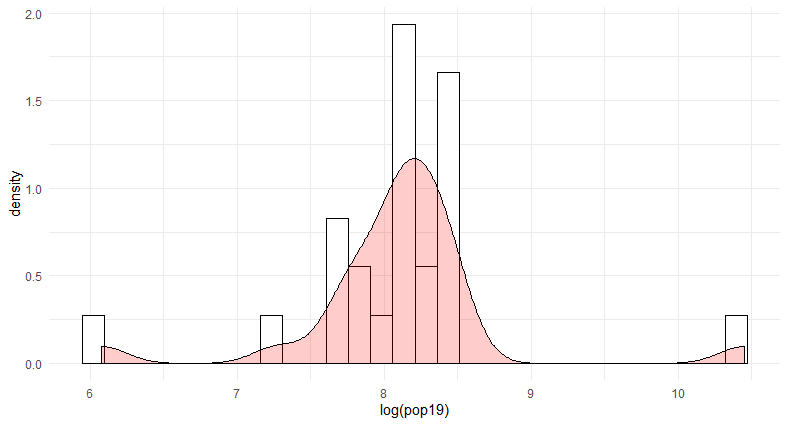 This plot shows the population density with the logarithm of the population.
Water
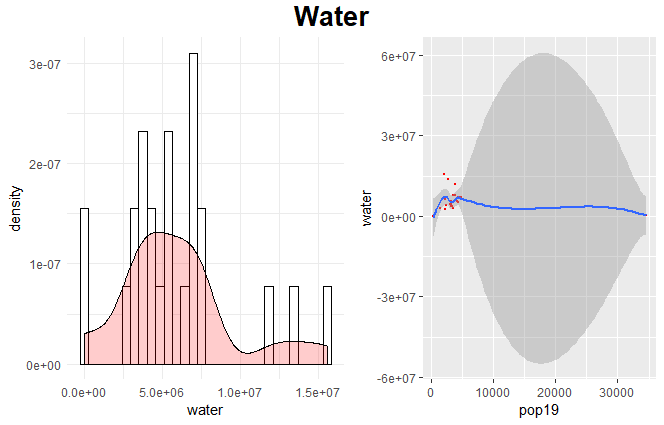
I first made a model of just water source variables to predict the population of Khovsgol. I chose to start with just water because of Mongolia’s history of having a nomadic population, and water sources would be one factor driving movement. Additionally, most major cities were developed along waterways. However, using just the one variable was not very accurate. This inaccuracy is highlighted in the distorted shape of the linear model.
Topo
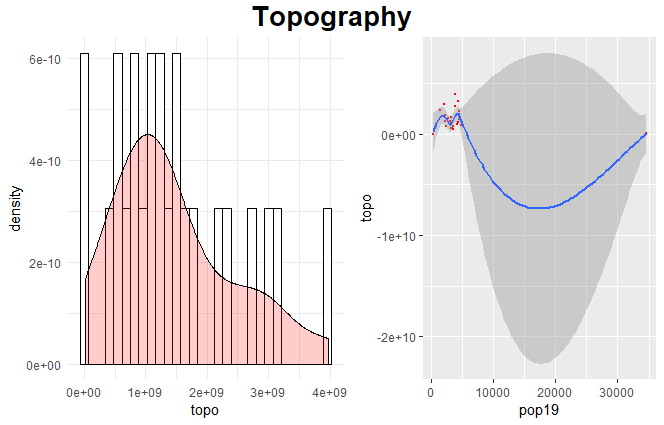
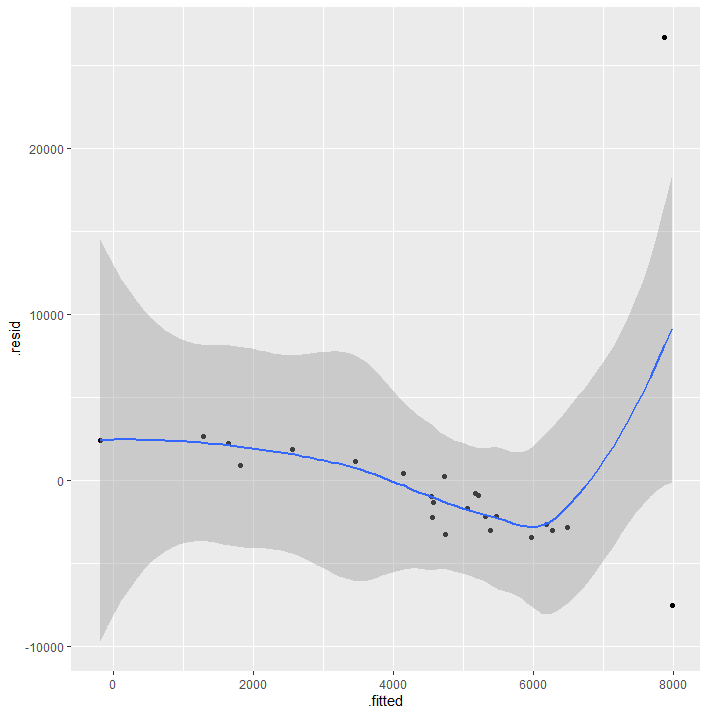
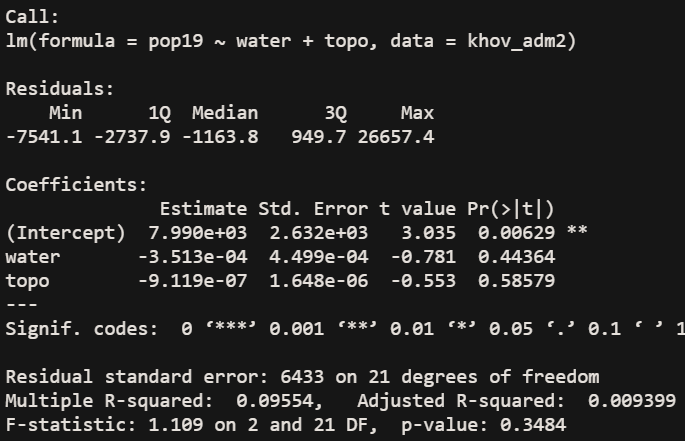
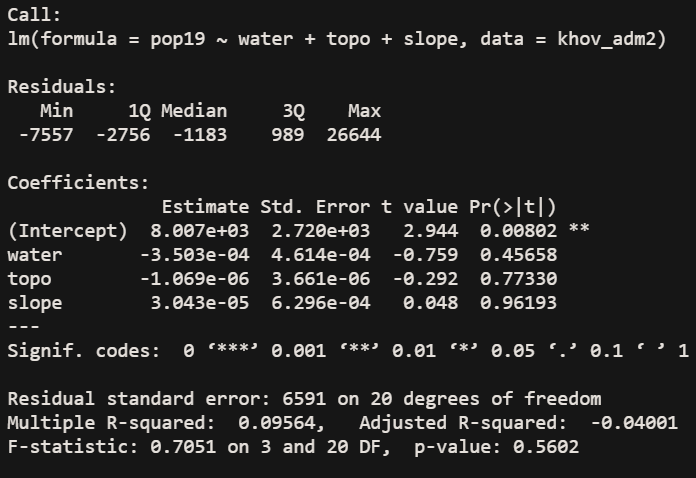
I then decided that in order to make a more accurate prediction while still exploring variables, I looked at topography. Again, topography would have played an important role in the history of Mongolia. Again, just using the one does not yield very accurate results. However, the linear model that combines water values and topography values is much more accurate than either of the single variables alone. Still, just using two variables yields a very low r^2 value of .094.
Slope
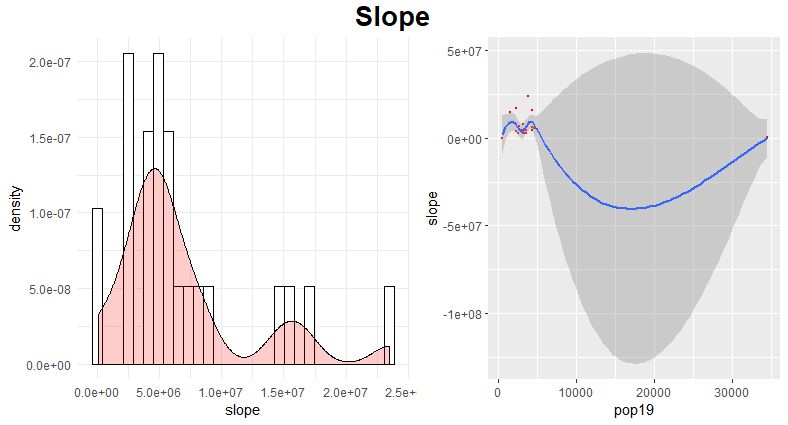
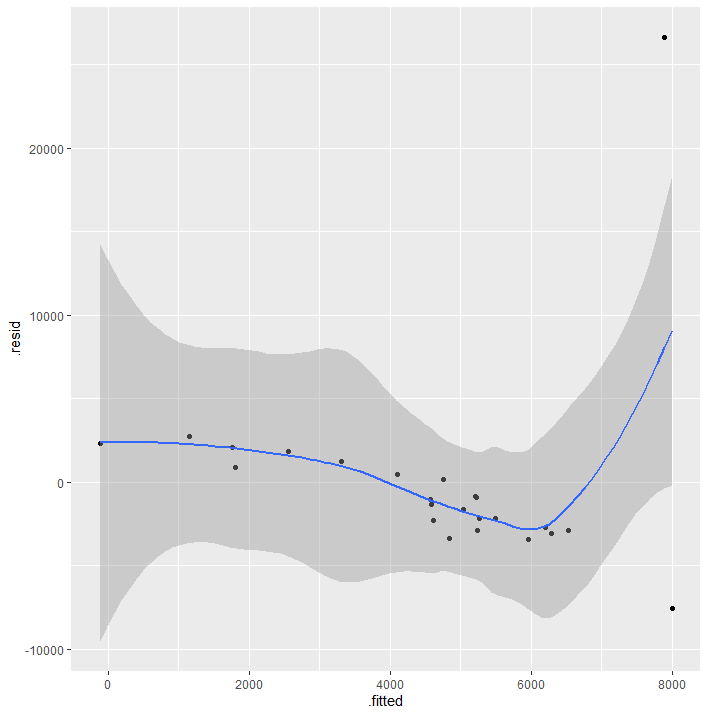
The final variable I explored individually was slope, for the same reasons mentioned above. Again, it did not prove to be reliable on its own. But, when combining slope data with topography and water data, the linear model is much more accurate.
All
The following are the results for combining all land use and land cover variables.
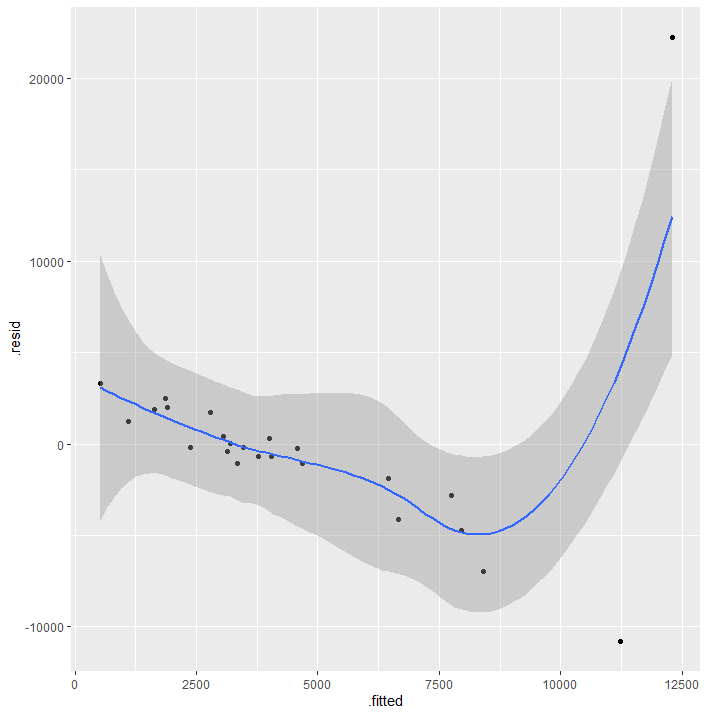
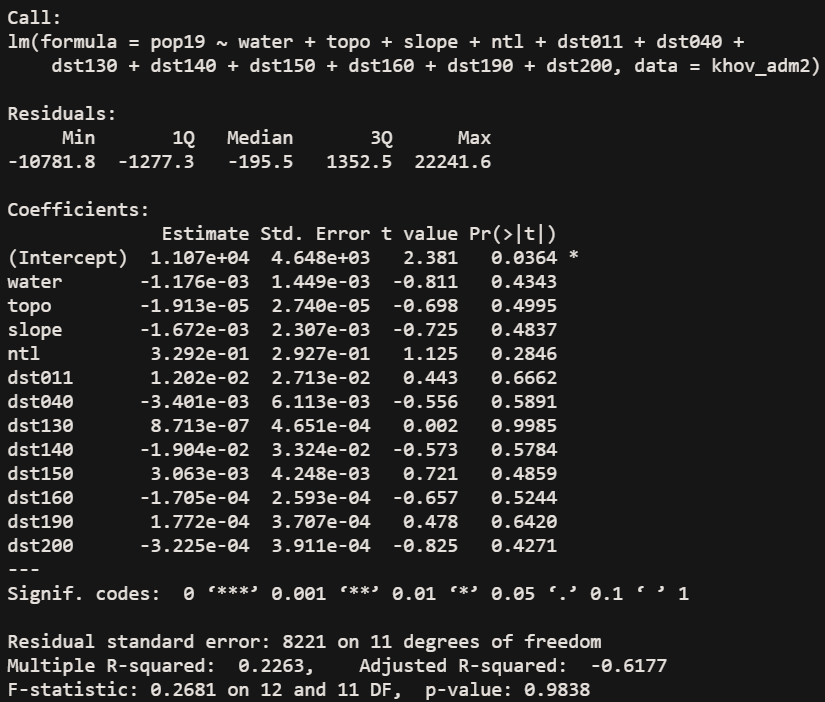 Again, the r^2 value is quite low, at .22. The correlation shown in the linear model is much improved when all of the variables are used. A low correlation would be expected, given the nature of Mongolia. The total population of Khovsgol is 132,146 as of 2017. This leads to a population density of 1.36 people/km^2 throughout the province. However, the capital city, Moron, has a population of 39,404 which is about 30% of the population of the province. As I noted last time, the population density grows about tenfold when you’re considering just that city. However, even with these considerations in mind, the r^2 value is quite low. The great variety in terrain, the presence of nomadic populations, and the large Lake Khovsgol could all contribute to the inaccuracy of this model. I think the biggest cause is nomadic people, due to the fact that yurts probably don’t show up when looking at built land satellite data and that they would not contribute much in terms of night time light values.
Part 2: Modeling and Predicting Spatial Values
In this part of the project, the dependent variable is the actual population. This value is being predicted by the geospatial covariates discussed and explored in the first part of the project. First, I looked at Khovsgol as a whole.

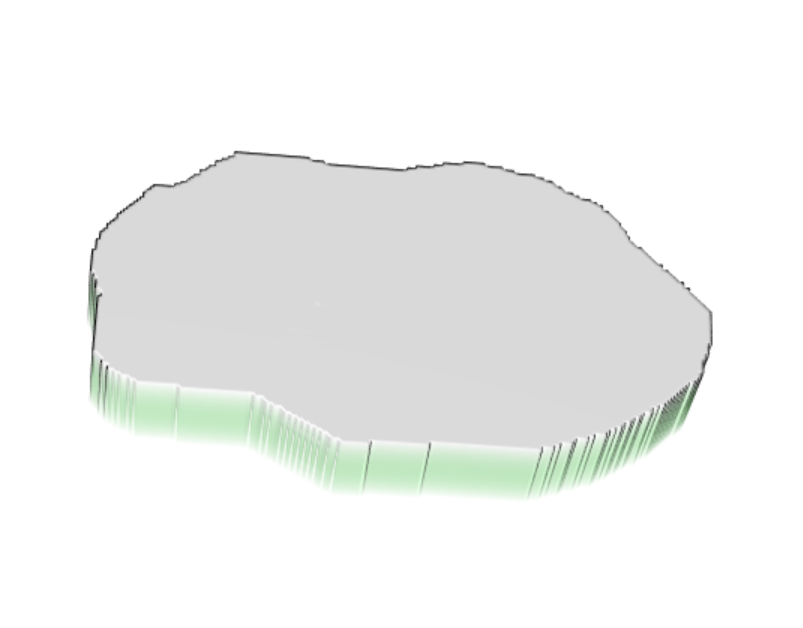
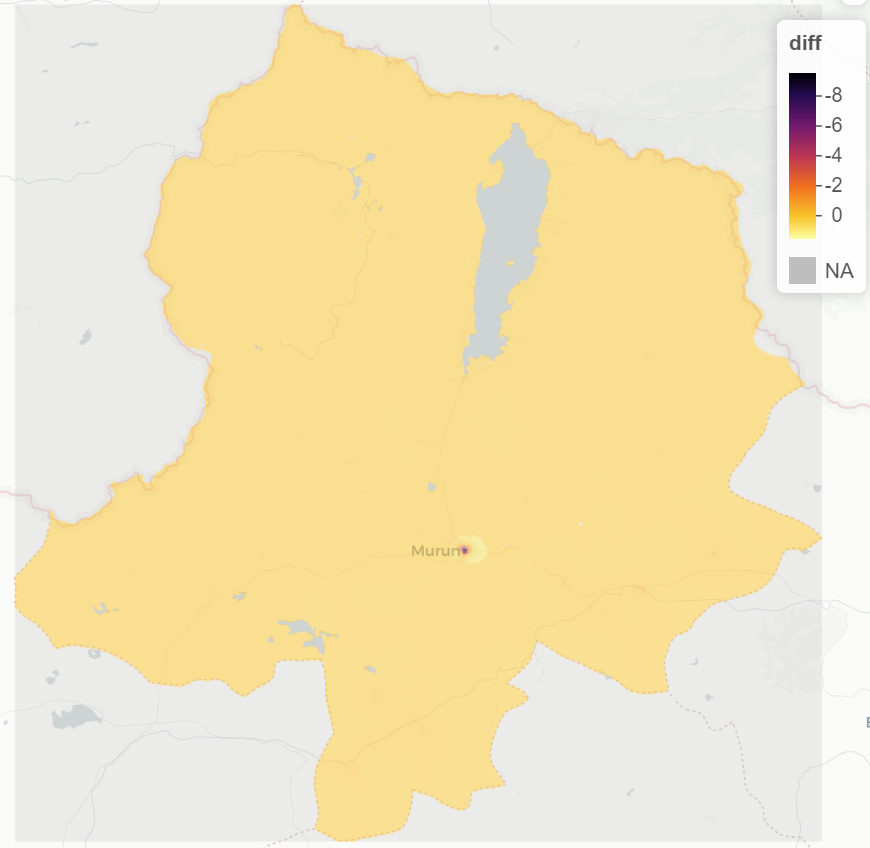 These two images show the difference in accuracy between the predicted population and the actual population of Khovsgol. For the most part, the map is accurate. However, if you look at a 3D plot of the area, it becomes clear that there is a problematic spot, where the accuracy decreases and the population is being underpredicted.
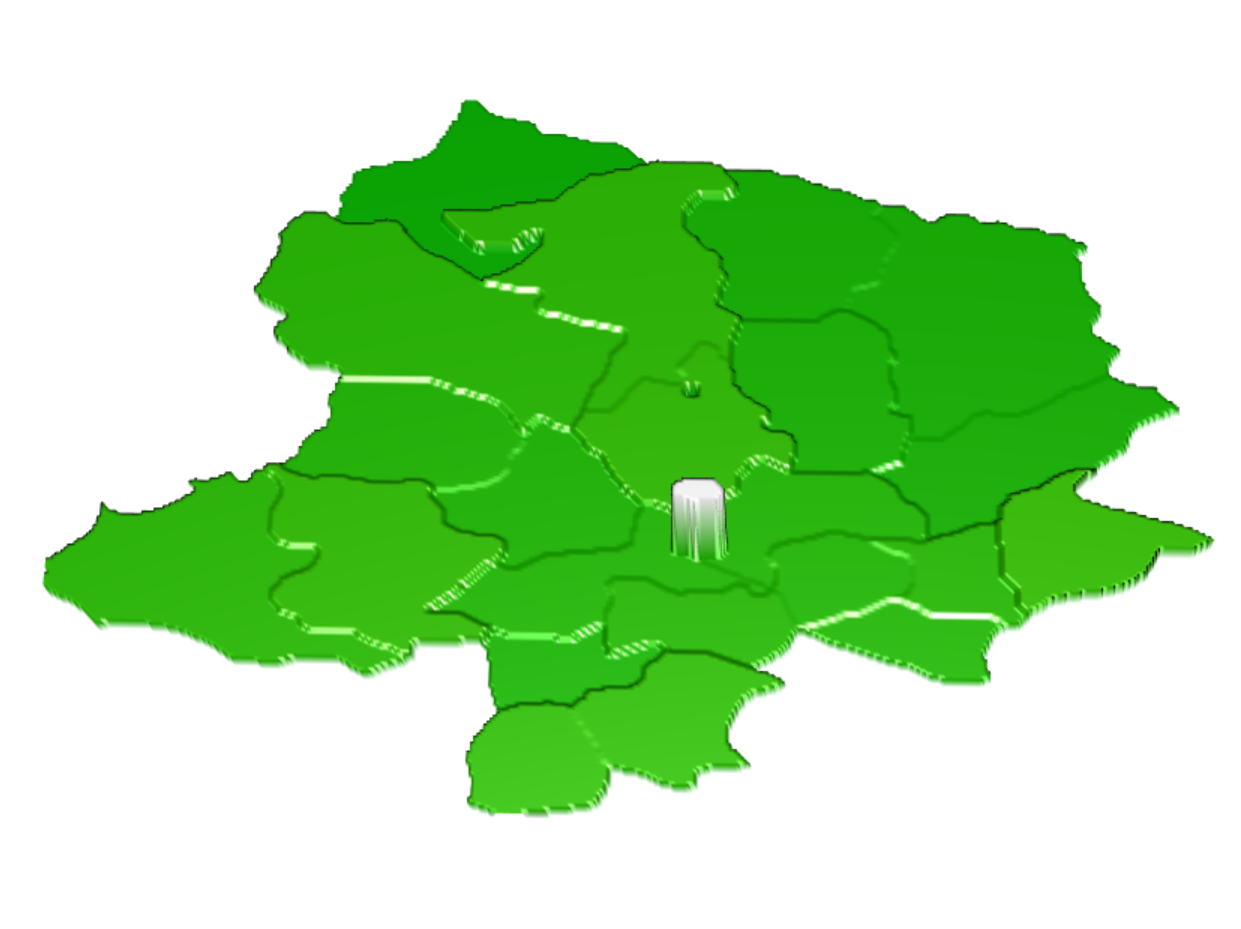 This would be the city of Moron, which is the capital of the province. It was greatly underpredicted by the model. Because Mongolia does not have ADM3 boundaries, I could not subset this data further to see differences clearly within the city.
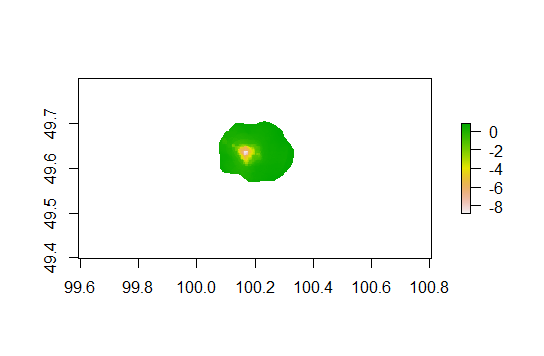
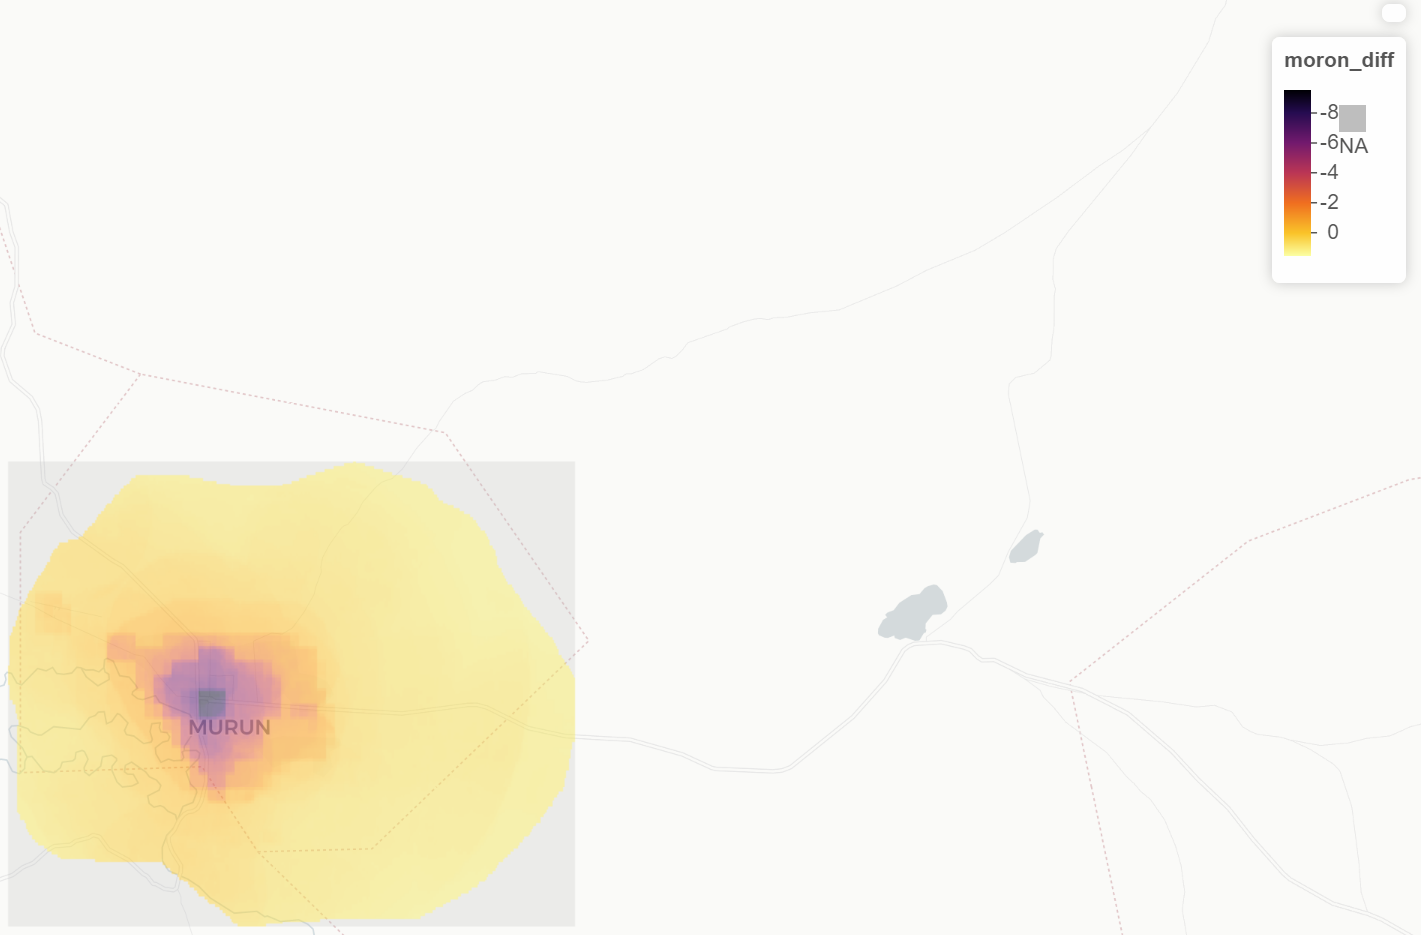 However, even without ADM3 values, you can still see that the underprediction gets worse in the center of the city due to the gridcelled approach to prediction.
Conclusions
I am not particularly surprised that Mongolia’s population prediction was not very accurate. As I discussed above, the nature of the population makes it difficult to precisely track. The small size and underdevelopment of the one city in Khovsgol also added to the error.
The most difficult part of the project was the technology. My laptop updated itself, which caused some errors with the needed libraries. I also ran into problems with the version of R that I was using. Most frustratingly, the internet at my house is about a tenth of the speed I can get at school (averaging about 2 mb/s download and .3 mb/s upload speeds at home) and is being used by four people for online classes. This is causing the work of downloading data extremely slow. This is why I was unable to use 2015 population values in this project. It also makes doing the work for this class and all of my other classes that much more time consuming.